Peter Lyons
Lighting Up Your JavaScript With the Debugger
The Debugger is a Fantastic Comprehension Aid
For most of my time as a programmer, I've been in the "no fancy tools camp". I spurned IDEs (and still do), complex build tools, any flavor of a "project" file an editor needed to supplement the filesystem layout, code analyzers, coverage tools, and all that ilk. I got things done by printing to stdout, kept it simple, and moved on. Not that I haven't tried all of these things at some point or another (periodically), but I found all of them were so awkward and cumbersome that not a single one of them stayed in my tool box beyond that initial experimentation or a single project.
However, things have changed with the current state of the Chrome developer tools debugger. I now use this tool constantly and find it to be an absolutely key piece of my arsenal. It's definitely in my top five most valuable tools list. It's not absolutely necessary, but getting by without it now feels like groping around in the dark when there's a perfectly good light switch available.
I attribute this mostly to the fact that Chrome made this tool built-in to the browser and ready to go with the click of a context menu. No plugin. No extension. No special developer build. No configuration file. It's just there and it works.
However, my main goal with this post is not to convince you to use the debugger because it will allow you to find a fix specific bugs more quickly. I want to convince you that stepping through your program in the debugger is a fundamentally valuable experience that will massively increase your understanding of the JavaScript language, the runtime, your own code, and the libraries you are using. It's exploratory, connected, illuminated, and surprising. The analogy I make is if writing to stdout is shining a flashlight on a particular variable value in your program, running the debugger is a bright lantern lighting up huge areas for you. You will see things without having to be specifically looking for them in a particular place a priori.
How to Use the Debugger
Get a Good UI Setup
Invest a little time to get a good window layout and workflow for seeing the web page you are developing and the debugger. The debugger can dock to the bottom of the window, the right hand side, or separate into its own window.
Enable source maps and explore the other advanced settings under the gear icon.
Learn the Primary Debugger Concepts
These are your bread and butter primary tools.
- basic breakpoints
- step over, step into, step out of
- asynchronous code flow
- the call stack
Learn the Secondary Debugger Concepts
You don't need these very often, but under certain circumstances, they are essential to tracking things down effectively.
- watch expressions
- conditional breakpoints
- pause on exceptions
Debugger Quirks
Some lines won't accept breakpoints. I don't exactly understand all of these, so please post a comment if you can explain. Sometimes I think it's just syntax where a single expression spans multiple lines and Chrome elects one of those lines (the last one I guess) as the one where a breakpoint can go. Other times I suspect the optimizing compiler has altered the underlying code such that a breakpoint doesn't make sense there anymore, but that's just a hunch that could be entirely incorrect.
Reloading the page sometimes causes a phantom breakpoint to appear and the code to pause.
If you edit the code in the browser while it's running, breakpoints tied to line numbers can get out of alignment.
Overall the UI is pretty cumbersome and could be made much better with some more usability studies.
Write Debugger-friendly Code
Stick to one statement per line, and avoid complex nested expressions. Rather, put interesting values into variables where they can easily be inspected. So instead of this:
findWinningTeam(getTeamScores(teams), getRuleSet(lookupConfig(configName));
Make this more debugger-friendly (and more maintainer-friendly in general).
const config = lookupConfig(configName);
const ruleSet = getRuleSet(config);
const scores = getTeamScores(teams);
findWinningTeam(scores, ruleSet);
This is much easier to add breakpoints and inspect those intermediate values and step over line by line.
At the moment JavaScript code that heavily uses method chaining is frustrating in the debugger. Something like this is hard to step through and requires a series of step in and step out operations.
get("/users").header("Accept", "application/json").auth(user, password).end(function (error, users) {});
I'm not a big fan of the chaining style in general, but in particular it's a pain when working in the debugger.
Debugging Server Side node.js (v8-inspector)
As of node.js v6.3.0 and newer there's support for debugging via the chrome developer tools inspector built right into node core. No need for helper modules from npm and no need for a separate node-inspector server.
To debug a server:
- run it with
node --inspect server.js. - in chrome, open a tab with
chrome://inspectaddress - Click "Open dedicated DevTools for Node" (Look at the bottom of the "Devices" section)
If you need to debug a crash during the initial program load, you can use node --inspect-brk server.js to tell the debugger to immediately pause at the start of the program so you can step through and find any early startup bugs.
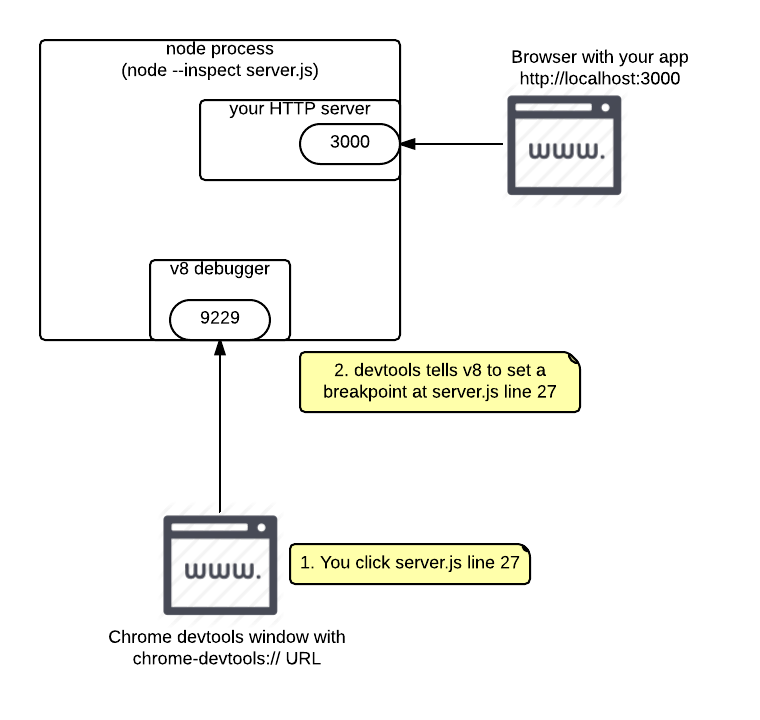
Under the hood, here's what's happening.
- Your node server program runs one process, which includes v8
- Running node with the
--inspectargument tells node/v8 to enable the debugger and have it listen for connections on a port, which is 9229 by default. - Your node server program listens on some port for its requests. For a typical web application, this might be port 3000, for example.
- So that's 1 node process listening for browsers on port 3000 and a debugger user interface on 9229
- When we use the chrome DevTools, it connects to the node process's debugging interface and we're up and running. The same mechanism is used by third party debuggers such as Visual Studio Code, IDEs, etc.
Debugging mocha Tests
To use node --inspect-brk (v6.3.0 or later), you can run your mocha tests with node --inspect-brk $(npm bin)/_mocha --timeout=0.
To avoid port collisions, you can provide an alternate port to the process for your mocha tests. This can be done with mocha --inspect-brk=6666, for example if you want to leave your application process's debugger listening on 9229 while you run mocha tests at the same time debugging them via port 6666.
Debugging tape Tests
You can run tape tests in the debugger by running node directly instead of the tape CLI program, and telling node to run the tape entrypoint script.
node --inspect-brk $(npm bin)/tape my-test-tape.js
Debugging tap Tests
You can run tap tests in the debugger by running node directly instead of the tap CLI program, and telling node to run the tap entrypoint script.
node --inspect-brk $(npm bin)/tap my-test-tap.js
For tap it works either way if you run the tap test runner program or even just a single tap test suite file. For example:
node --inspect-brk some-test-tap.js.
Some Workflow Tips
For projects I'm doing active, heavy work on, I usually run them under node-dev for automatic restarting on change and always enable the debugger, so node-dev --inspect server.js. If I have several projects or microservices that would otherwise create a TCP port conflict binding port 9229, I will pass a project-specific port like node-dev --inspect=9230 server.js.
Recommended Reading
- Node Inspector Docs
- Chrome Developer Tools Docs
- HTML5 Rocks Introduction to Chrome Developer Tools
- Lesser-Known JavaScript Debugging Techniques
- Debugging Asynchronous JavaScript with Chrome DevTools
- Watch Me Code Debugging Screencasts by Derrick Bailey